


This database was produced by Development Intelligence Lab Senior Analyst William Leben and Analyst Ruby Saulwick. It is the first of its kind. The Lab team will continue to update the data to reflect changes at both the annual Budget and Mid-Year Economic and Fiscal Outlook (MYEFO).
Every effort has been made to provide coherent comparisons between departments and over time; however, differences in budget paper accounting, data availability and accepted methods mean that any result is bound to be imperfect.
All data is in Australian dollars and has been adjusted for inflation for both historical numbers and forward estimates.
The data underlying this analysis is drawn from all relevant departmental or agency portfolio budget statements. These figures differ, for instance, from the total resourcing figures provided in Budget Statement No. 4 (‘Agency Resourcing’), which generally provides higher estimates but often includes resourcing that is not usefully available to a given agency. All agencies were provided with an opportunity to review this database.
Our resulting compiled dataset, inclusive of calculation methods, is freely available upon request. Note that for some agencies prior to around 2009–10, it is sometimes necessary to consult physical archives.
The Australian Government publishes detailed statistical summaries of the ODA budget year-to-year, and there are well-established, authoritative OECD-DAC rules and definitions of what is and is not counted as ODA. We have replicated the nominal data contained in DevPol’s Australian Aid Tracker database, which in turn replicates official information, however, we have applied our own inflation adjustments.
Correctly scoping spending in the foreign affairs and trade portfolio is more difficult than might first be imagined. This database includes two different approaches. The first is what we have referred to as ‘Foreign affairs and trade’. This sums Outcomes 1, 2 and 3 in the Department of Foreign Affairs and Trade (DFAT) PBS, Austrade (Outcome 1) and the ACIAR (Outcome 1). ODA is removed from this estimate by removing programs 1.2 and 1.3 within DFAT Outcome 1 from the total (that is, removing ODA administered by DFAT from the estimate, rather than the total ODA budget). We have not referred to the ‘Department of Foreign Affairs and Trade spending’ because the measure captures the wider portfolio. This produces a reasonable estimate for broadly construed non-ODA foreign affairs spending. The figures in this database, and most recent paper therefore differ from that presented in our longer, earlier report, Balancing Act, linked below.
We have also included a measure of the foreign policy ‘operating’ budget, which we refer to as the ‘diplomatic’ budget, replicating James Wise’s approach in his 2022 report The Costs of Discounted Diplomacy. This restricted measure aims to provide an estimate of the budget that determines, ‘for example, how many people [DFAT] can employ, the individual budgets for posts overseas, divisions in Canberra and state offices in Australian capital cities, and the budgets for public diplomacy, sponsored visits and training’. It takes DFAT’s Outcome 1 budget alone and eliminates all administered expenses. In other words, it excludes corporate functions, such as IT, as well as important DFAT responsibilities, like consular support, in order to provide a useful measure of what the diplomatic budget is.
The time series produced for foreign affairs and trade clearly appears ‘lumpy’. This reflects inconsistent major administered spending (for example, through Austrade during the Covid pandemic) or significant organisational re-structures (the AusAID merger in 2013, which produced a brief diplomatic operating budget spike even though administered ODA is excluded from this calculation).
Historical data for Defence has been replicated from ASPI’s Cost of Defence database, with recent years completed using the equivalent headline measures contained in Table 4a (‘Funding from government’) of the Defence PBS.
Spending for DIO and AGO (which, alongside some ADF intelligence capabilities, comprise the ‘Defence Intelligence Group’ or DIG) is subsumed within the Defence portfolio and not available separately.
Spending for ASD is part of the Defence portfolio but is provided in disaggregated form in the PBS. Budgets for DSD, which preceded ASD, were never provided; accordingly, it is not possible to establish a useful long-view time series for the Signals Directorate.
Our survey of NIC budgets includes ASIO, ASIS, ACIC, AUSTRAC and ONI (or predecessor agencies). For the reasons of data availability described above, we have not counted DIO or AGO. It is also difficult to capture the budget lines for the intelligence functions of the Australian Federal Police and the Department of Home Affairs, which are part of the formal 10-agency definition of the NIC; thus, these have also not been captured.
We have used an outcomes basis to calculate NIC funding. Each NIC agency reports against a single ‘outcome’ in the relevant PBS. This provides a lower figure than total departmental resourcing; however, it provides a more accurate indication of useful and available funding for each agency.
ASD has been counted within Defence per departmental reporting, and it has also been included and discussed in the NIC section. While it makes sense to discuss the ASD budget as part of the NIC at present, a lack of reporting under previous DSD arrangements means it is not possible to do so from a historical perspective, and double handling is therefore appropriate.
The data for ACIC prior to 2016–17 is a combination of the Australian Crime Commission and CrimTrac agency budgets. Prior to 2002–03, it is the budget of the National Crime Authority. Prior to 2018–19, the data for ONI is that of the then-ONA.
There are availability and consistency issues in compiling the time series for ASIS to include 1999–00 and 2000–01, with no neatly matching outcomes reported. Therefore, for these two years, we instead use the ‘Output Appropriation’ reported in 2000–01 and available on Trove.
We have removed the portion of the AFP budget spent on purely domestic outcomes (Outcome 2) and summed the other estimated actual totals that pertain to federal functions (Outcomes 1g and 3, although only the former before the outcome reporting change in the PBS that occurred in 2020–21). This is, once again, less than perfect.
Unfortunately, it is not possible to further disaggregate the AFP budget using PBS data. This aggregate total accounts for the evolving organisational structure and movement between the Attorney-General and Home Affairs portfolios. In addition, there is missing data for the year 2005 in the PBS due to changing output structure.
We have not included a comprehensive comparison of Australian development financing that neatly mirrors the other sections of the paper, and it is not possible to do so. Readers should refer to cited sources for the loans and programs described.
We have included the Department of Home Affairs for purposes of comparison. However, we have not included more detailed data or a standalone section for this department. We have also not attempted to construct an equivalent budget estimate for relevant agencies prior to the establishment of the Home Affairs portfolio.
Where a Home Affairs budget figure has been included, we have used the total of reported Outcomes 1, 2 and 3 rather than a total departmental resourcing basis. This approach is consistent with our estimates for both DFAT and the NIC.
It should be noted that a more constrained estimate would be provided if we excluded Outcome 2, which essentially covers the immigration program. Immigration is clearly a significant part of Australia’s place in the world and region. However, there is an equally valid argument that for comparative purposes here, the more important measure of Home Affairs funding is its more explicit security-related functions.
GDP is per the Australian Bureau of Statistics Modellers Database, June 2024 release ($2.671t). Inflation adjustments have been produced using the June 2024 CPI number (138.8) provided by the ABS and forecasts for inflation. Historic data and forward estimates are all adjusted relative to 2025-26 using these index numbers, summarised below.
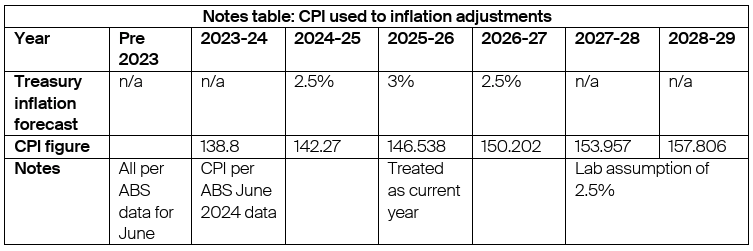
ABS CPI data has also been used to produce inflation adjustments to nominal budget figures. The forward estimates have also been adjusted for inflation, based on Treasury assumptions about CPI in Table 1.1 of Budget Paper No. 1. This is an imperfect tool, given that inflation impacts might credibly be different in specific sectors (e.g., large military capital acquisitions) or destinations (e.g., a specific ODA destination country), but it still provides a straightforward adjustment from the perspective of Australian budgets over time.
Dr. Cameron Hill, Dr. Marcus Hellyer, James Wise, Melissa Conley Tyler, ASPI and DevPol for their work, which has been used extensively in this paper. We hope that this work will similarly inform subsequent analysis.
All errors, whether methodological or analytical, remain the sole responsibility of the lead author.

